本文讲如何使用 matlab 画图。 本文包括:折线图的 x轴和y轴、标题、图例 柱状图填充图案
折线图
接下来讲的matlab如何设置图形的图例和x轴的距离
折线图的图例需要知道的是 Legend ,使用他可以进行设置
    legend(...,'Location',LOC) adds a legend in the specified
    location, LOC, with respect to the axes.  LOC may be either a
    1x4 position vector or one of the following strings:
        'North'              inside plot box near top
        'South'              inside bottom
        'East'               inside right
        'West'               inside left
        'NorthEast'          inside top right (default for 2-D plots)
        'NorthWest'          inside top left
        'SouthEast'          inside bottom right
        'SouthWest'          inside bottom left
        'NorthOutside'       outside plot box near top
        'SouthOutside'       outside bottom
        'EastOutside'        outside right
        'WestOutside'        outside left
        'NorthEastOutside'   outside top right (default for 3-D plots)
        'NorthWestOutside'   outside top left
        'SouthEastOutside'   outside bottom right
        'SouthWestOutside'   outside bottom left
        'Best'               least conflict with data in plot
        'BestOutside'        least unused space outside plot
如何设置x轴大小?
可以通过set(gca,'xtick',1:1:100);代码设置从1开始,结束100,解释一下
set(gca,'xtick',开始:两个点之间:结束);
直方图
如何画柱状图,如何在柱状图使用不同的图案填充?
matlab 柱状图填充图案可以使用 applyhatch 画图,下面将告诉大家如何做
第一步是复制文件applyhatch.m到自己电脑。关于applyhatch.m到哪里下,请自己百度,如果寻找不到,可以联系我lindexi_gd@163.com
才不告诉在这里下
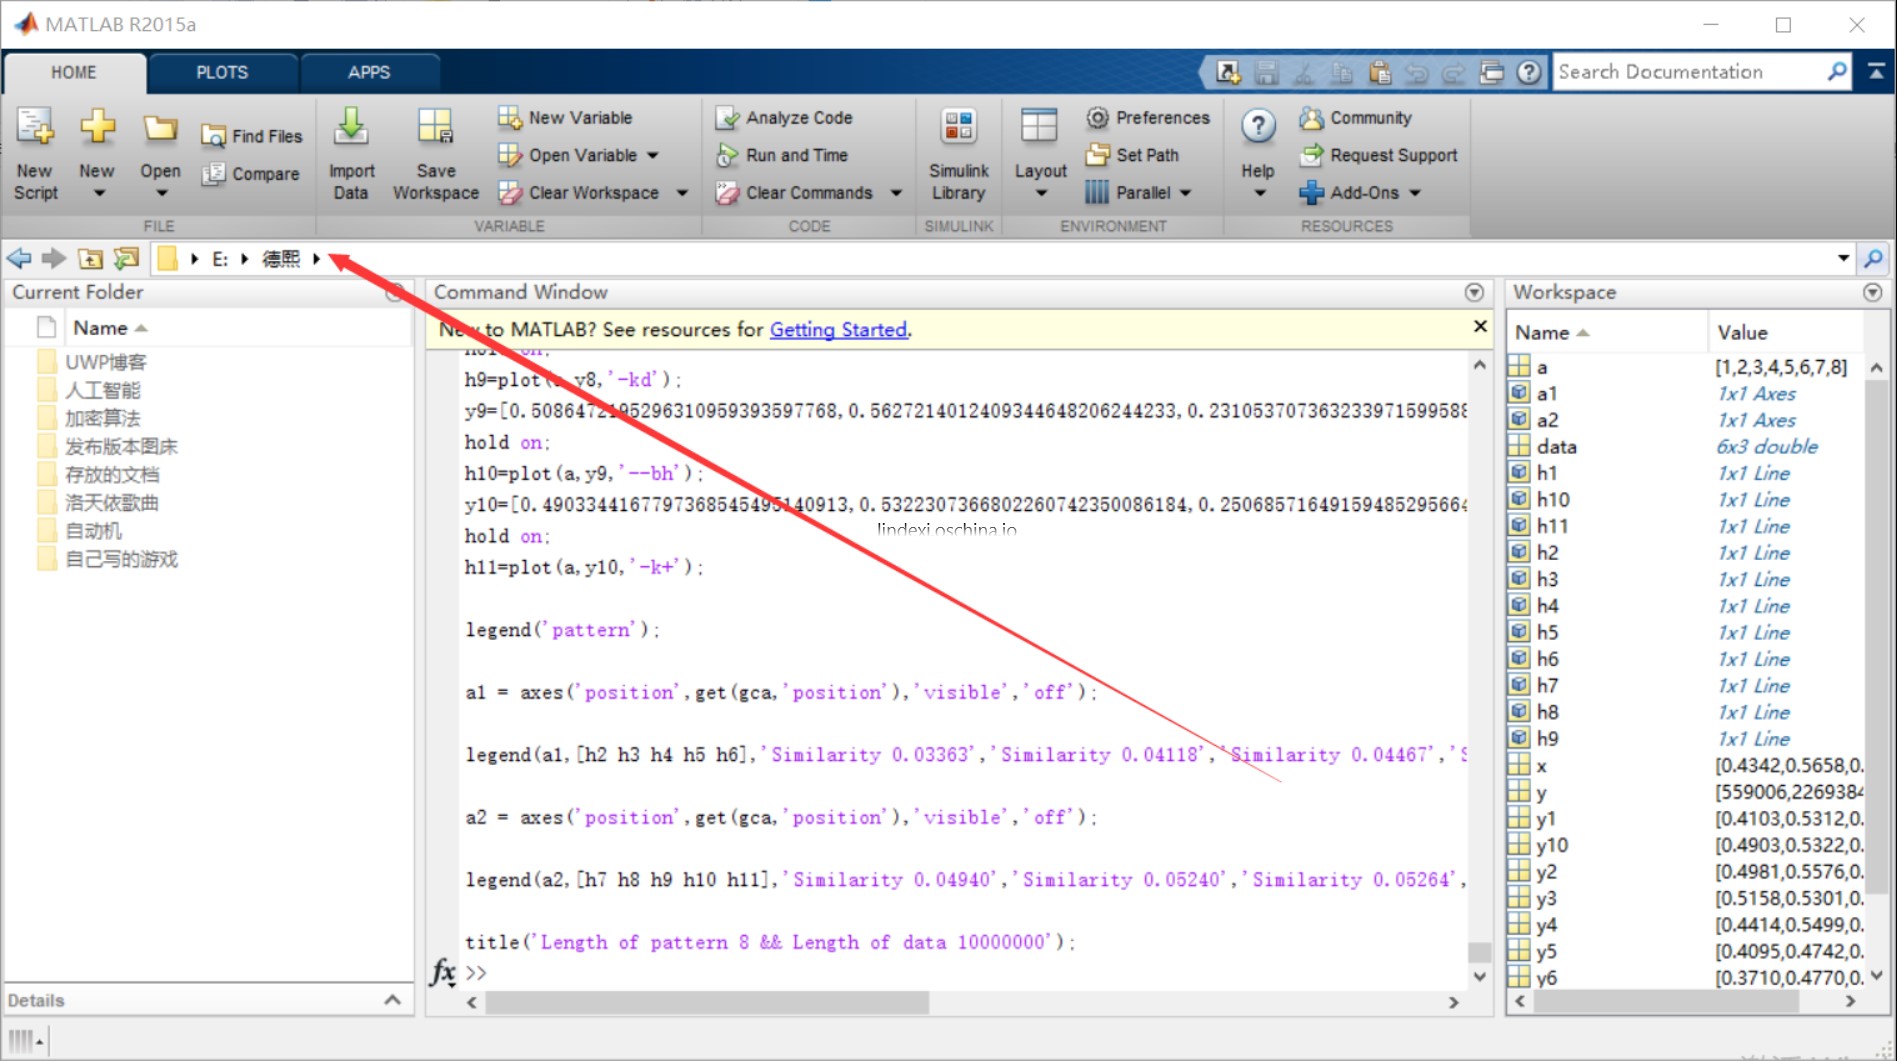
第二步是把文件拷贝到工作台,工作台是什么,就是软件打开的文件夹路径,这个路径如下图

可以自己修改,只要把上面的文件放在这个文件夹就可以了。
使用方式是applyhatch(gcf,'\.x.');
其中第二个参数就是使用不同的图案,可以使用添加'/', '\', '|', '-', '+', 'x', '.'几个字符
例子:
    close all
clear all
clc
% The computer journal paper
% Jigang Wu etc.
% copyright: lonchen@mail.ustc.edu.cn


% data = [31,32,35;72,73,75;113,114,117;144,146,147;171,173,174;213,215,220];
data =[16,17,18;33,34,37;51,54,55;71,74,74;86,91,91;105,113,113];
bar(data,1);
axis([0 7 0.0 150]);
legend('DPA','TSRP','GRP',0);
grid on;
set(gca,'XTickLabel',{'100','200','300','400','500','600'});

xlabel('The number of internal nodes');
ylabel('The number of replica that created');
set(gcf,'Color','w'); % 设置背景颜色为白色,否则坐标轴出现区域的颜色为灰色
applyhatch(gcf,'\.x.');
对于不同组合的直方图,使用 data=[数据1.1,数据1.2,数据1.3;数据2.1,数据2.2……]
然后画出来,使用bar(data,1); 第二个参数是宽度,自己尝试修改第二个值跑一下。
可以使用图例,matlab的图例使用的legend('DPA','TSRP','GRP',0); 有多少个数据就添加对应图例。
试试下面代码:
    y=[559006 ,2269384,783762;508559 ,2140905,696001;506491,2007763,735464]
bar(y,0.6)

legend('n','N','l')
grid on;
set(gca,'XTickLabel',{'第一次','第二次','第三次'})

xlabel('匹配次数')

ylabel('结果数')

set (gcf,'Position',[500,500,500,500], 'color','w')

applyhatch(gcf,'\.x./');


set(gcf,'Color','w');

如果过程遇到问题,可以联系我 lindexi_gd@163.com。
感谢陈龙师兄的帮助。
本文会经常更新,请阅读原文: https://dotnet-campus.github.io//post/matlab-%E7%94%BB%E5%9B%BE.html ,以避免陈旧错误知识的误导,同时有更好的阅读体验。
 本作品采用
知识共享署名-非商业性使用-相同方式共享 4.0 国际许可协议
进行许可。欢迎转载、使用、重新发布,但务必保留文章署名
lindexi
(包含链接:
https://dotnet-campus.github.io/
),不得用于商业目的,基于本文修改后的作品务必以相同的许可发布。如有任何疑问,请
与我联系
。